Showing posts with label GIS 5103. Show all posts

Wednesday, August 3, 2016

Module 11, Sharing Tools


In this lab, we corrected a few minor parameter errors in a script before successfully embedding the script into the tool for sharing. Below is a screenshot of what the tool's dialog box looks like as well as the outputs of the tool.

   
Ending notes for the semester:
Out of this whole semester,  I couldn’t pinpoint one single thing as the most interesting, as it was all (very) new and interesting to me and definitely memorable along the way (as in major stress, memorable). However, I eventually (and admittedly) enjoyed leaving my comfort zone with each successful code compilation. That being said, I expect I will use coding (of my own will) in the future.

Wednesday, July 27, 2016

Creating Custom Tools

This week, we created a custom toolbox and modified a script tool to go with it.


Here is what the script tool dialog box looks like.

Here is what the tool dialog window looks like after using .AddMessages() in the script.

Here is a list of the basic steps required to make a custom toolbox and script tool.
1.       Create/modify a python script.
2.       Create a custom toolbox.
3.       Add your script tool to the custom toolbox using Add>Script after right-clicking toolbox.
4.       Set the parameters of the tool in the properties to match your script.
5.       Edit your script if necessary by setting the parameters of the script using arcpy.GetParameter()
6.       Modify print statements to arcpy.AddMessage() statements to ensure messages appear in the geoprocessing environment tool dialog box.
7.       Share your toolbox, tool, and script by compressing your script and parent toolbox into a compressed (zip) folder.


Tuesday, July 19, 2016

Working with Rasters

In this week's lab, we worked with rasters and the arcpy.sa module. We were asked to write a code that would reassign values to an assigned raster, as well as reclassify those values to the raster. We created temporary rasters for Slope and Aspect, performed calculation statements from them, and combined the results of those calculations with the reclassified raster to create the raster output below. We created this code all within an if/else statement for checking the Spatial Analyst Extension, as these wont compile unless you have a license for it.

Here is a screenshot of my output raster below:

Here is a flowchart for my script below:

This is the step I had the most difficulty with:
1.       I had the most difficulty with the Slope and Aspects statements in part f of step 3.
2.       I kept getting only 0 (in other words, one solid color on my raster) as a result in my output raster, as it would only recognize the landcover raster.
3.       I realized I was missing my Aspect variable before the four temporary statements (I had the Slope variable already made, I guess I overlooked Aspect somehow), also I had to capitalize Slope and Aspect in the variable assignment and the four statements.

Wednesday, July 13, 2016

Writing Geometries

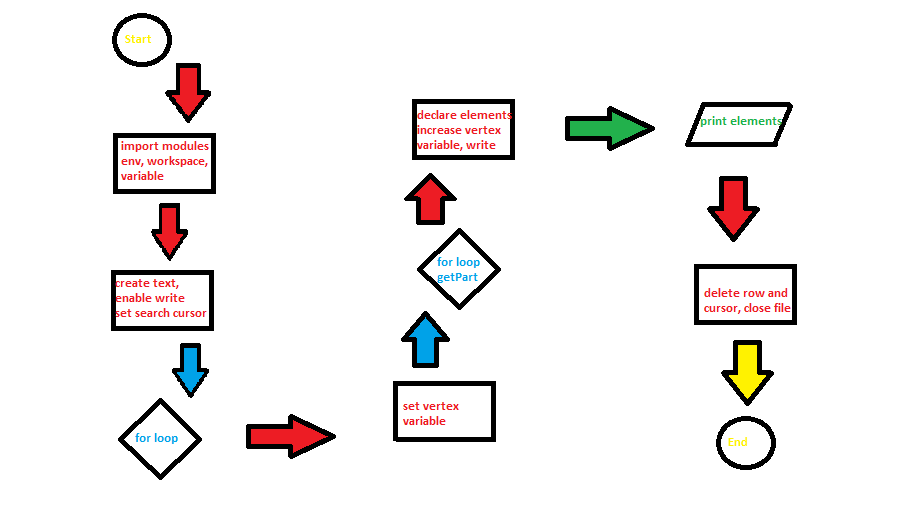
   In this lab we worked with a river shapefile, set up a search cursor with nested for loops in order to declare some of its geometries, and wrote those geometries to the text using the .write method. Below is a snip of what a portion of the text file result looks like.


Here is the flowchart of the code, with pseudocode below.


Pseudocode:
Start
Import modules
Import env
Set workspace
Set variable

Create text, enable writing
Set SearchCursor array 
For loop
Set vertex ID variable to 0
For loop/get.Part method
Element 0 of cursor array declared (feature #)
##Vertex ID printed
Element 1 of cursor array declared (x, y coords)
Element 2 of cursor array declared (name)
Vertex ID variable increased by 1
Write argument declared 
Print statement showing all five elements in single line format
Delete row and cursor
Close file

Sunday, July 10, 2016

Peer Review #2

Geoprocessing tool to model beach erosion due to storms: application to Faro beach (Portugal)
 
By: Almeida, et. al
 
   This article introduces a geoprocessing tool, called GEOSTORM, which was created with the purpose of allowing users to run Kriebel and Dean’s storm erosion convolution model in ArcMap. This GIS application supports the preparation and conversion of the data produced by the model into a format usable in a GIS environment (i.e. shapefiles, etc). The application consists of two parts: Module 1, which is where the user inputs data related to their study area, and Module 2, the actual storm erosion model.

   The authors state that each module was designed with different programming languages (Python and Matlab), but do not explain the reasoning behind this. They do communicate through ArcObjects using VBA. I would like to have known if this is more or less efficient, or if it was the only way to get Kriebel and Dean’s model to run in ArcMap efficiently.

   Module 1 and 2 setup and directions are in need of more explanation. While their explanation is ok, it would not hurt to be more specific and detailed for each step the user needs to take to set up and go through the modules. The study scenario was a little unclear in some areas, and I felt like some aspects of the study could have been explained better for those outside of the discipline. Figure six is a good example and helped me better understand the results of the study.

   Overall, this application/tool sounds like it is useful and could help out coastal decision-makers prepare for incoming storms. However, the information concerning it is lacking and seems rushed out. I would like to have had more background information about the processes of each module, considering potential users would be most interested in how it works.

http://search.proquest.com.ezproxy.lib.uwf.edu/environmentalscience/docview/1675866765/abstract/9065FD92DC0B493DPQ/40?accountid=14787

Tuesday, June 28, 2016

Exploring and Manipulating Spatial Data

Here is the general flow of my code:
Hardest part of the assignment for me:
       I had the most difficulty with step 7 (creating a for loop to populate the dictionary). I was under the impression that a separate for loop had to be made in order to populate the dictionary. I was able to print out the cities with the population underneath them alright, but my list would not appear at the end of the results when I tried adding another for loop underneath (completely separate from) my search cursor code.
       The solution was to simply add the dict.update function in the for loop of the previous code where I conducted a search for the fields I was trying to isolate. The rows (AKA fields), not the field names, are integral in performing the update to the dictionary, I found out.

Here is the results of my script:
In this lab, we had to create a code that would make a new geodatabase in our results folder, search for certain fields in one shapefile's attribute table, and display those fields by populating an empty dictionary with the results.

The screenshot shows the shapefiles that were copied into the geodatabase and print messages stating when a certain part of the process was completed. It prints that the search for the certain attribute table fields is underway and also that it completed. Finally, it prints a message that the dictionary is being updated and completed, with results of the dictionary underneath. 

Tuesday, June 21, 2016

Geoprocessing with Python

Steps I took to make my script:
1.       I imported arcpy, set the workspace environment to the module 6 data folder, and set the overwrite output environment to true.
2.       I set the hospitals shapefile as a variable (input_feature) in order to be added to the map.
3.       I made a try statement comprised of three components. The first component adds the hospitals using the AddXY management tool with the hospitals set as the variable ‘input_feature’. The second adds a buffer of 1000 meters to the hospitals and saves the output into my results folder. The third dissolves the hospitals buffer and saves the results into my results folder. All three components get a print messages statement directly after their implementation. This shows a message that the tool ran and details about its process.
4.       Last I incorporated an except statement that would print the message “An error has occurred.” if any of the above processes fail.
This shows the flow of my script.

Here, the print statements display the messages left by the tools after running.

Wednesday, June 15, 2016

Geoprocessing with ArcGIS

   In this weeks lab, our objective was to create a toolbox, create a model in that toolbox, and export the model into a script that is usable outside arcmap.

   This flowchart shows the process of how the model-turned -script is run.


   This is what the outcome of the model looks like. The model took two shapefiles (basin and soils), and used the Clip tool to clip the soil type to the basin. Next, the Selection tool was used to select not prime farmland out of the soil types in the basin. Finally, the Erase tool was used to erase the not prime farmland from the basin polygon.

   Here are the steps I took to create the Erase function in my model:

1.       I dragged the Erase tool into my model.
2.       I double-clicked the tool to bring up the dialog box.
3.       I set the Input Features as basin and the Erase Features as my Select_Soils selection. I named the Output Feature Soil_Erase.
4.       I right clicked the Output Feature in the model and clicked Add To Display.
5.       I ran the process. I unchecked the display of all other layers in the dataframe except the Soil_Erase to ensure that the Not Prime Farmland was indeed erased from the basin.

Monday, June 13, 2016

Peer Review Assignment 1

Development of Python-FALL3D:
a modified procedure for modelling volcanic ash dispersal in the Asia-Pacific region

By: A.N. Bear-Crozier, Nugraha Kartadinata, Anjar Heriwaseso, Ole Nielsen

This article talks about the simplification of a volcanic ash dispersion model called FALL3D. This modelling program is already widely used by many countries, such as Italy and Iceland, who experience volcanic activity periodically. However, FALL3D requires extensive experience and background knowledge of computational modelling to run properly. Individuals with experience such as this is lacking in developing countries such as Indonesia, a major volcanic hotspot in need of a volcanic ash dispersal modelling program.
The solution presented by the authors was the development of a script written in the Python coding language that modifies the procedures that run the modelling program. This script, called Python-FALL3D, automatically streamlines the installation process and makes inputting and processing data simplified throughout the code by allowing the user to execute each process in single-steps. This allows those with little or no background in computational modelling to use this program.
The research conducted behind the benefits and limitations of this script are conclusive and honest. The developers have thoroughly tested FALL3D in other volcanic ash hazard regions with good results and are positive that its application can be put to use in the Asia-Pacific region. Contrarily, while the program itself is simplified, it is still dependent upon several other factors, such as internet connectivity, experience using the Linux operating system, and its codependency on other complex programs in order to operate correctly. As mentioned earlier, individuals with experience running programs like these are lacking in developing countries, and access to a reliable internet connection may not be possible in some regions of Asia-Pacific.
The developers do an excellent job explaining the installation process as well as methods of collecting and preparing meteorological data relevant to the region. They provide an applicable scenario displaying the computational models’ efficiency by simulating the volcanic ash hazard of the active volcano Gunung Gede, in West Java, Indonesia. The processes underlying the script along with a scenario of its theoretical application are in tangent with each other, and the charts and figures greatly enhance the understanding of the process and results.

 In theory, the application of Python-FALL3D in the Asia-Pacific region would immensely aid cities in close proximity of active volcanoes by being able to forecast volcanic ash landfall direction and speed. The fact that it is also available free and open source to download show the willingness and dedication of its creators to make the script available to those who need it. The only drawback I can see is the actual usability this program will receive in the Asia-Pacific region due to aforementioned factors.

Monday, June 6, 2016

Debugging and Error Handling

   This script contained a few syntax errors that prevented it from listing the field names in the attribute table of a shapefile.
    This script contained syntax errors, incorrect pathfile locations, incorrect methods, and I had to adjust the parameters of a method. It lists the layers found in this module's map document.
    This script incorporates a try/except statement to catch an exception, instead of fixing the errors. Catching an exception bypasses the error statement when trying to run the code and instead prints out  the main issue. The second part of the script runs successfully and lists the name of the data frame, the set spatial reference of the map document, and the scale of the map document.
   This flowchart shows the process of the second script (second screenshot).
   This is how I incorporated a try/except statement into the third script:
1.      I added ‘try:’ to the top of the code, highlighted the rest and tabbed it.
2.      I added ‘except Exception as exc:         print “An error has occurred.”            Print exc          to the bottom of the code as shown in the mod 4 lecture.
3.      I only did this for Part A, as the directions for Part B said it would run successfully.

Tuesday, May 31, 2016

Python Fundamentals Part II

   This screenshot shows the results of a code that performs a dice rolling game based on the length of the players' name and creates a random list of 20 integers between 0 and 10. A conditional statement with a while loop is created to target a variable (the number 5 in this case) and remove it from the list for however many times it appears.

   How I created the code:

1.       I created a variable for the unlucky number then used a count method based on how many times the variable was in the list.
2.       I checked to see if the count variable was less than or equal to zero, if it was it would print “The number 5 is not in the list”
3.       If the variable was found in the list, a second conditional statement would state that the variable appeared and that its count would be deleted for however many times it appeared. Ex) the number 5 will be deleted 4 times.

4.       Next, a while loop was created in the second conditional statement that if the count of the variable was greater than zero, it would remove the variable count by 1 until the variable was completely removed from the list.

Saturday, May 21, 2016

Python Fundamentals Part 1


  For this lab, a script was made that would preview my full name, last name, and then the number of letters in my last name multiplied by three. 

   The full script included a written string of my full name, the string made into a list that split into individual names, my name indexed through printing, a function to find the length of my last name, a statement that multiplied the length of my last name by three, and the printing of the last name length multiplied by three.

   Here is an excerpt of how I calculated the length of my last name in PythonWin:
1.       This function wasn’t a task in the lab exercise, but I remembered it being used as a function in the reading.
2.       I wrote the first code as: name = “Priscilla Marie Woodrow”             len(Woodrow). Which was wrong because I forgot to add quotation inside the parenthesis, which specifies the object.

3.       It runs as: name = “Priscilla Marie Woodrow”          len(“Woodrow”)

Saturday, May 14, 2016

Introduction to Python

   This lab was an introduction to Python by running a script through PythonWin.

Here is what the script I ran did:
   The script created a new folder for the class called GISProgramming, with 12 folders for each module and three sub-folders in each for various outputs. This saves time from having to tediously create all the folders in one sitting or as the assignments come. It also assures all our folders are similar and easy to navigate through.

Here are the steps I noted while doing the task:

   1.       I copied the script from the R drive into a folder I made in the S drive for the class.
2.       I double-clicked the script to open it. I clicked the Run icon. It ran fast and I didn’t know where to expect to find it. I clicked back to the very beginning of my documents folder and found it there.
3.       I moved it from there to the next page, where I keep my main Data and Documents folders for other classes.