In this lab, our objective was to utilize different types of interpolation methods and to compare and contrast their uses in varying site scenarios.
This was my extra deliverable as a graduate student. This poster shows 5 different maps using varying powers of IDW interpolation. The final map on the bottom right shows the power I felt best portrayed the settlement pattern of prehispanic peoples in coastal Ecuador. This map also uses contouring to highlight the areas with a larger population.
This poster shows the varying density maps I used to portray population density at the Barriles site.
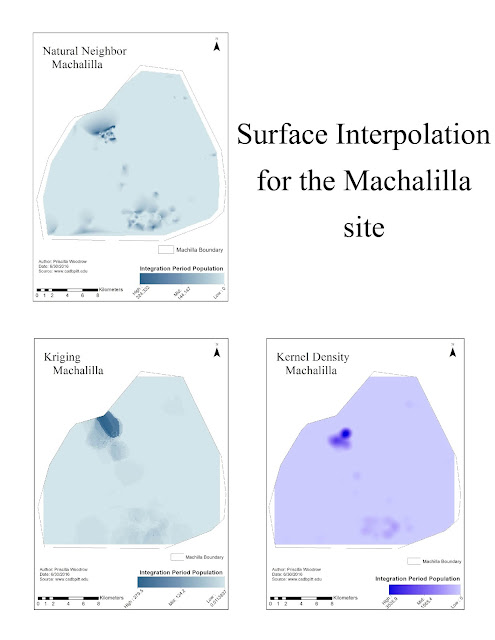
This maps shows the varying density maps I used for the Machalilla site.


No comments:
Post a Comment